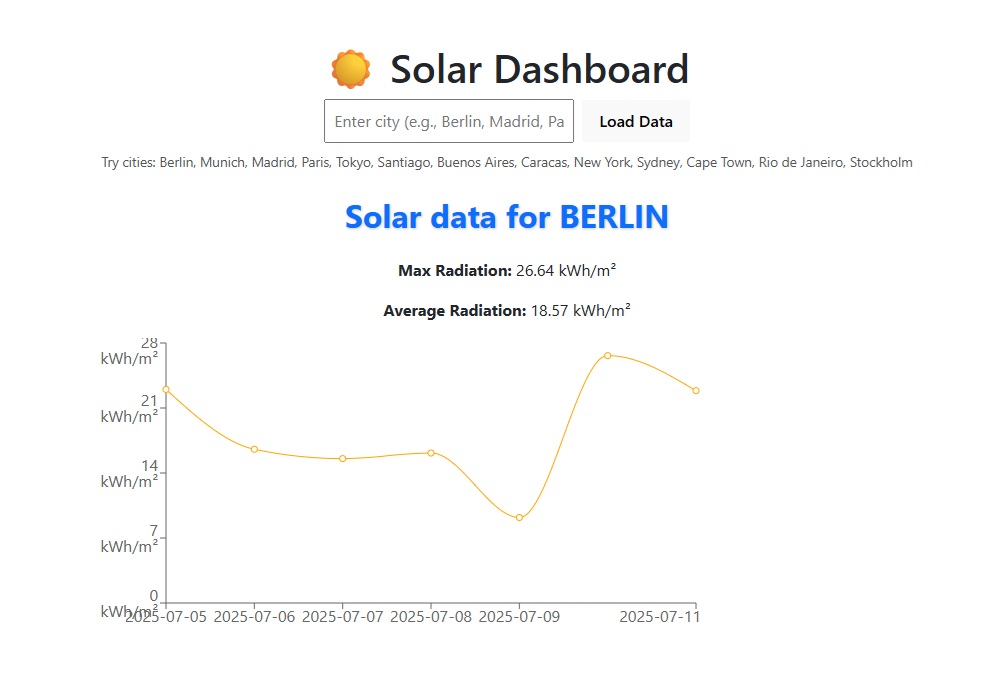
Una solución web que visualiza datos de radiación solar (en tiempo real) según las ciudades seleccionadas por el usuario. Permite a los usuarios visualizar gráficos y métricas clave del potencial solar utilizando datos reales de la API.
🔗 Probar Demo (Enlace externo: Puede tardar unos segundos en cargar)
Una herramienta para que los diseñadores solares:
✅ Buscar y cargar ciudades (Berlín, Múnich, Madrid, París, Tokio, etc.).
✅ Mostrar la radiación máxima y media diaria (kWh/m²).